Financial Diary: Earnings Quality

The objective of the blog is to analyse the earning quality for KMD and MVN. It even talks about the uncertainty in the economic environment and how it affects KMD and MVN.

1. KMD and MVN have adopted and prepared their financial statements prepared in accordance with GAAP NZ,  NZ IFRS and comply with IFRS hence consistent with the industry norms (Subramanyam & Wild, 2009). Both companies do not have an aim to boost a particular component the way Enron’s aggressive accounting policy was aimed to boost the share prices (Hogan, Rezaee, Riley & Velury, 2008).

2. KMD and MVN do not have much flexibility in choosing an accounting policy as in New Zealand every public entity has to present its financial statements as per NZ GAAP, NZ IFRS (Subramanyam & Wild, 2009). The companies are in an industry where they have more tangible assets and revenue recognition does not need much judgements (NZ IAS 18) hence more straightforward.

3. Price Water House Coppers are the auditors for KMD and MVN and have give both the companies an unmodified opinion hence the companies have no accounting problem or problem of management integrity (Subramanyam & Wild, 2009).

4. KMD and MVN are both profitable companies hence the companies are not prone to desperate means. There has been no auditor resignation or changes on a regular basis for KMD and MVN (Subramanyam & Wild, 2009). There has been no sudden increase in inventory compared to sales (refer figure 1).

*figure 1

Analysis of favourable and unfavourable factors:

*NZD & AU (figure 2)

 *NZD & GB (figure 3)

The New Zealand dollar has been buffeted around by the storm that erupted in global financial (Kerr, 2011). KMD and MVN operate Australia (AU) and Great Britan (GB) which are most affected (Kerr, 2011). Due to the volatility in the economies and the currency both companies can be affected hence proving unfavourable for both the companies (refer figure 2 and figure 3).

Performance of the portfolio:

Though the economic environment is uncertain I can conclude after the preliminary analysis, analysis of operating and cash flow that both the companies KMD and MVN are fundamentally strong and can be considered as a good investment.

*The above analysis is based on the past one year annual report for KMD and two years for MVN. 

Position Summary (298)

Symbol Description Qty Cost Basis Price Value P/L Action
KMD Kathmandu Holdi… 10000 2.030 2.140 21,400.00 1,100.00 Activity Close
MVN Methven Limited… 10000 1.390 1.420 14,200.00 300.00 Activity Close

References

Hogan,C., Rezaee, Z., Riley, R., Velury, U. (12 May 2008). Financial Statement Fraud: Insights from the Academic Literature Auditing: A Journal of Practice & Theory 27 (2), 231 (2008), doi: 10.2308/aud.2008.27.2.231

Kathmandu Limited (2011). Share Prices. Retrieved from: https://www.nzx.com/markets/NZSX/securities/KMD

Kerr, R. (2011). Hesitancy and uncertainty are the future of our economy and currency. Retrieved August 15, 2011 from http://www.interest.co.nz/currencies/54877/hesitancy-and-uncertainty-are-future-our-economy-and-currency.

Methven Limited (2011). Share prices. Retrieved from: https://www.nzx.com/markets/NZSX/securities/MVN

NZX Limited. (2011). The New Zealand Stock Exchange. Retrieved from:  https://www.nzx.com/markets/NZSX/sectors/G05

Subramanyam, K. R., & Wild, J. J. (2009). Financial Statement Analysis (10th ed.). New York, NY Press, F., & Siever, R.

X-Rates.com. (2011). Exchange rates graph (Australian dollar, Great Britan pound and New Zealand dollar). Retrieved from http://www.x-rates.com/d/NZD/AUD/graph120.html

Financial Diary: Cash Flow Analysis

The objective of the blog is to analyse the Statement of Cash flow of KMD and MVN. Operating activity, Investing activity and Financing activity will be the three main areas for analysis.

*figure 1

*figure 2

*figure 3

Cash Flow from Operations (CFO): click on the following link for the definition of CFO http://www.investopedia.com/terms/o/operatingcashflow.asp#axzz1YRONrlbz.  A company cannot exist for long without cash (Erich, 2001). The following graph states that for KMD the CFO has increased from $24685000 in 2009 to $32603000 in 2010 (refer at figure 4). The increase was due to increase in receipts from customers and decrease in payments to suppliers and employees. MVN’s CFO decreased $16547000 in 2009 to $9419000 in 2011, due to decrease in receipts from customers and increase in payments to suppliers and employees (refer at figure 1).

*figure 4

Cash Flow from Investing (CFI):  click on the following link for the definition of CFI http://www.investopedia.com/terms/c/cashflowfinvestingactivities.asp#axzz1YRONrlbz. KMD  has invested $12823000 in PPE and in intangibles causing CFI to be negative in 2010 (refer at figure 4). MVN the CFI has been negative since 3 years as they have been continually investing in PPE, patents, trademarks and software, $ 3659000 for 2011 (refer at figure 3).

Cash Flow from Financing (CFF):  click on the following link for the definition of CFF http://www.investopedia.com/terms/c/cashflowfromfinancing.asp#axzz1YRONrlbz . KMD  CFF outflow increased by 98.23% from -$4851000 in 2009 to -$47558000 (refer at figure 4). KMD returned advance loans of $258511000 for the year 2010 causing an increase in cash outflow (refer at figure 2).  In contrast MVN CFF decreased as they paid dividends $ 7327000 for 2011 (refer at figure 3).

Analysis of the favourable and unfavourable factors of KMD’s and MVN’s performance:

The operating cash flow for both the companies has never been negative, which shows that the companies have good control over it expenditures (refer figure 2 & figure 3). CFI is negative for KMD and MVN but still favourable as it is a result of heavy investment expenditures, which is not bad (Richards, 2007). Similerly CFF is negative for KMD and MVN but still favourable as KMD has reduced its debt and MVN has given dividends. (refer figure 2 & figure 3).

Performance of portfolio:

The portfolio is making profit. This gain does not make any difference (will not sell and book profit) as the current portfolio is a long term investment. The operating activities shows that KMD and MVN are financial healthy hence have less to worry about my investment.

*click on the above figures to enlarge. All figures used are from the annual report of KMD and MVN.

Position Summary   (Word Count: 295)

Symbol

Description

Qty

Cost Basis

Price

Value

P/L

Action

KMD Kathmandu Holdi… 10000 2.030 2.190 21,900.00 1,600.00 Activity Close
MVN Methven Limited… 10000 1.390 1.450 14,500.00 600.00 Activity Close

References

Erich, H. (2001). “The Nature of Financial Statements: The Cash Flow Statement”. Financial Analysis – Tools and Techniques – A Guide for Managers. McGraw-Hill. p. 42. doi:10.1036/0071395415

Kathmandu Limited (2011). Share Prices. Retrieved from: https://www.nzx.com/markets/NZSX/securities/KMD

Methven Limited (2011). Share prices. Retrieved from: https://www.nzx.com/markets/NZSX/securities/MVN

NZX Limited. (2011). The New Zealand Stock Exchange. Retrieved from:  https://www.nzx.com/markets/NZSX/sectors/G05

Richards, D. (May, 2007). Interpreting the Cash Flow Statement. How to use financial statements as a management tool, Part 3. Retrieved September 15, 2011 from http://entrepreneurs.about.com/od/beyondstartup/a/cashflowstate.htm.

Financial Diary: Operating Activities

The objective of the blog is to analyse the operating activities which include nonrecurring items, deferred charges and the revenue recognition criteria’s. The analysis would be more qualitative rather than quantitative.

Nonrecurring items:

An entry that emerges on a company’s financial statements for a one-time expense that is unlikely to happen again. These one-time events are separated on the income statement and classified as either non-recurring or extraordinary (Kennon, 2010). Kathmandu Ltd and Methven Ltd have no items that can be classified as extraordinary (concluded after looking at the financial statements).

Deferred charges:

They are cost incurred that are deferred because they are expected to benefit future periods. Research and Development (R&D) and computer software expenses are two types of deferred charges that we gone discuss (nd, 2011). 

Revenue recognition KATHMANDU LTD (KMD)

KMD recognises revenues on the following basis.  For the full annual report click on the following link companyresarch.nzx.com/reports/nz/2010/KMD2010.pdf.

Revenue recognition METHVEN LTD (MVN)

MVN recognises revenues on the following basis.  For the full annual report click on the following link www.methven.com/ykfiles/7fb6aa28a551d100a6e11c5e1b829edd/Full+Annual+Report.pdf.

Expense Recognition for KMD and MVN:

Both the companies recognise there expense as they are incurred (Kathmandu & Methven, 2011). Selling, distribution and administration expenses for KMD and MVN are expenses once they are incurred (Kathmandu & Methven, 2011).

Justification of favourable and unfavourable:

KMD and MVN has no items that can be classified under this category. We can say it is favourable as having no item under this category raises fewer questions.

Deferred charges is favourable for KMD and MVN as they follow NZ IAS 38 and the expenses incurred and the cost to be recognised as asset is done based on the recognition criteria as per NZ IAS 38 Para 57.

KMD and MVN recognise revenue which comply with the recognition criteria as per NZ IAS 18. The only inconsistency that can be seen is for MVN LTD. MVN recognises royalties on an accrual basis. Royalty income should be recognised when item from which royalty is earned is recognised (Methven Limited, 2011).

Expense recognition can be concluded as favourable as they follow NZ IAS and NZ IFRS. KMD and MVN recognise expenses once incurred hence avoiding any discrepancies.

Performance of portfolio:

KMD is doing better compared to MVN.  Mainly after the comments of Peter Halkett the MD and CEO that “Kathmandu sales have gone up mainly due to tourist coming in New Zealand for adventure sport causing a growth in the equipment segment”, hence showing good sign for my investment (Gregor, 2011).

*All the analysis is based on the past 3 year annual report for MVN and for KMD it is based on 2010 annual report. KMD was listed on the NZX in 2009. Click on the pictures to enlarge.

Position Summary (296)

Symbol Description Qty Cost Basis Price Value P/L Action
KMD Kathmandu Holdi… 10000 2.030 2.150 21,500.00 1,200.00 Activity Close
MVN Methven Limited… 10000 1.390 1.450 14,500.00 600.00 Activity Close

                                                                                                                                                      Reference

Deferred charge. (n.d.). Retrieved September 18th, 2011, from http://business.yourdictionary.com/deferred-charge.

Gregor, K. (2011). Kathmandu credits weather for 30 per cent sales surge. The New Zealand Herald. Reterived September 18th 2011fromhttp://www.nzherald.co.nz/business/news/article.cfm?c_id=3&objectid=10723227.

NZX Limited. (2011). The New Zealand Stock Exchange. Retrieved from:  https://www.nzx.com/markets/NZSX/sectors/G05

Kathmandu Limited (2011). Share Prices. Retrieved from: https://www.nzx.com/markets/NZSX/securities/KMD

Kennon, J. (2010).  Accounting for Extraordinary and Nonrecurring Items or Events Investing Lesson 4 – Analyzing an Income Statement. Retrieved September 18th 2011 from http://beginnersinvest.about.com/od/incomestatementanalysis/a/accounting-for-extraordinary-events.htm

Methven Limited (2011). Share prices. Retrieved from: https://www.nzx.com/markets/NZSX/securities/MVN

Financial Diary: Preliminary Ratio Analysis

The objective of this week’s blog is to identify the preliminary ratios for my investment in Kathmandu Limited (KMD) and Metheven Limited (MVN). This analysis would help evaluate the strengths and weaknesses of KMD and MVN.

  *click on the picture to enlarge.

Justification for favourable and unfavourable performance:

EPS

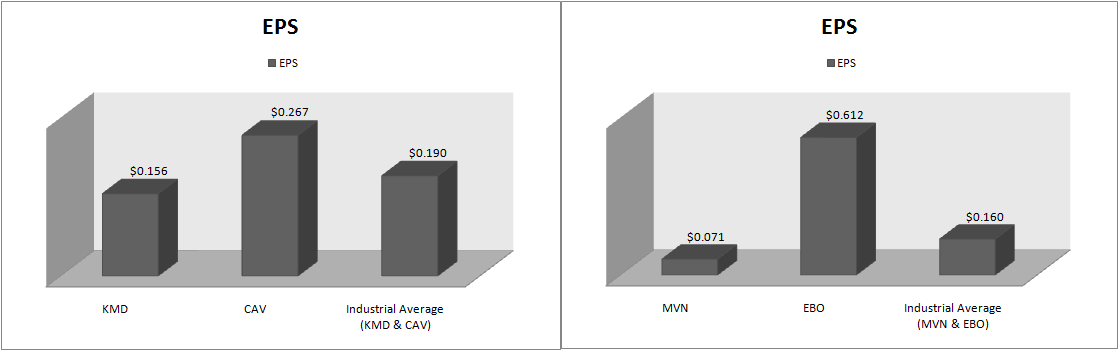
It is portion of a company’s profit allocated to each outstanding share of common stock. KMD has EPS of $0.156 per share and $0.071 per share for MVN (Kathmandu Ltd & Metheven Ltd, 2011). EPS for KMD and MVN is less than the industry in which they operate hence unfavorable. For better understanding of the EPS ratio click on the following link http://www.investopedia.com/video/play/earnings-per-share#axzz1XFSomqhX.

P/E Ratio

P/E ratio is the amount investors are willing to pay relative to each dollar of earnings. KMD P/E ratio is 34.82 compared to 12.88 for CAV (Cavalier Ltd, 2011). MVN P/E ratio is 20.84 compared to 11.11 for EBO. It is favourable as both the companies are in a sector expecting higher earnings growth in the future. To understand P/E ratio better click on the following link http://www.investopedia.com/video/play/price-to-earnings-ratio#axzz1XFSomqhX.

ROE

It is a measure that shows how efficient a company is at generating profit. The shares I have invested in are generating profit but less efficiently when compared to its competitors (Industrial Benchmark not available) hence unfavourable (CAV and EBO). To increase your understanding further for the ROE ratio click on the following link http://www.investopedia.com/video/play/return-on-equity#axzz1XFSomqhX.

Debt – to – Equity

It  measures a company’s financial leverage. Usually investors prefer companies with low Debt – to- Equity ratio. Saying that the Debt – to – Equity ratio depends upon the strategy of the company. For KMD it is favourable as it has $0.22 of debt for every $1 of equity compared to $0.56 of CAV. In contrast for MVN it is unfavourable as it has $0.46 of debt for every $1 of equity compared to $0.32 of EBO (Ebos Ltd, 2011). To better understand Debt – to – Equity ratio click on the following link http://www.investopedia.com/video/play/debt-to-equity-ratio#axzz1XFSomqhX.

Dividend Yield

It indicates how much a company pays in dividend each year relative to its share price. KMD and MVN pays more dividend compared to the industry and its competitors hence is favourable. For better understanding click the following link http://www.investopedia.com/video/play/understanding-dividend-yields#axzz1XFSomqhX.

Performance of portfolio:

Though some of the above ratios are unfavourable for my investment in the long run the company would do well. I said in my first blog I believe that being patient is a solid factor in determining success in investing.

*Kathmandu Limited has just been listed on NZX in 2009 hence no historical data is available.  Metheven Limited and Ebos Limited analysis is based on the average of last 3 year data. Basis of the calculation for all the ratios is shown in appendix 1.

Position Summary  (Word Count: 298)

Symbol Description Qty Cost Basis Price Value P/L Action
KMD Kathmandu Holdi… 10000 2.030 2.060 20,600.00 300.00 Activity Close
MVN Methven Limited… 10000 1.390 1.440 14,400.00 500.00 Activity Close

References

NZX Limited. (2011). The New Zealand Stock Exchange. Retrieved from:  https://www.nzx.com/markets/NZSX/sectors/G05

Kathmandu Limited (2011). Share Prices. Retrieved from: https://www.nzx.com/markets/NZSX/securities/KMD

Methven Limited (2011). Share prices. Retrieved from: https://www.nzx.com/markets/NZSX/securities/MVN

Cavalier Corporation Limited (2011). Share prices. Retrieved from http://companyresearch.nzx.com.libproxy.unitec.ac.nz/deep_ar/newpage.php?default=CAV

Ebos Group Limited (2011). Share prices. Retrieved from http://companyresearch.nzx.com.libproxy.unitec.ac.nz/deep_ar/newpage.php?pageid=livedata&default=EBO

Berman, K., Knight, J., Case, J. (October 7, 2008). Leverage Ratios – The Balancing Act: Financial Leverage for Entrepreneurs. Retrieved from http://hbr.org/product/financial-statement-analysis-identify-the-industry/an/TB0069-PDF-ENG?N=0&Ntt=Financial+ratios.

APPENDIX 1:

Financial Diary: Company Information

Company Back Ground:

Kathmandu: Established 24 years ago, Kathmandu has become a leading specialist in quality clothing and equipment for travel and adventure in New Zealand and Australia. Kathmandu has 55 outlets in Australia and 36 in New Zealand (Kathmandu Ltd, 2011). Methvens: Established in 1886, Methven is New Zealand’s longest established, largest supplier and leading designer of showerheads, faucets and hot water valves (Methvens Ltd, 2011).

Profile of products:

Kathmandu’s key product lines include apparels like technical wear, down jackets, thermals, fleece, woven casual wear, merino and equipments like packs, bags, sleeping bags, tents, camping accessories, footwear and socks (Kathmandu Ltd, 2011). Methvens on the other hand sells products like home spa, bathroom showers, kitchen ware and laundry. Satin jet, fast flow and ceramic discs are some of the other products they sell. The company has developed their own brands like Echo, NEFA and Steriline (Methvens Ltd, 2011).

Markets and business segments:

Kathmandu’s business segment comprises 60% apparel and 40% equipment. Families and individuals who go camping, skiing and hiking are their market segments. Methvens business segment include providing services of home renovations and plumbing. The market segments for the company are hotels, motels and under-construction houses.

Daily and monthly share price: 

                                          Share price history for 30 days

Kathmandu Limited

Methven Limited

Market – to – book value:

Market – to – book value in theory is 1:1, but in practical life the market price of the stock is always greater than its book value. It measures the amount at which the market values the company relative to its book value. *For Kathmandu Limited it is $1.64 and Methven Limited is $1.84.

Alternative information sources used:

The rugby world cup is about to stimulate millions of dollars in the retail market increasing business confidence and consumer spending, hence showing positive signs for my first selected company Kathmandu Limited (Vaughan, 2011). The re-development in Christchurch is expected to create a boom in the manufacturing and the construction sector (Brown & Hosking, 2011). Methven Limited would ultimately be benefited by the boom where they can sell their products as well as provide services.

                                                            Position Summary

Symbol Description Qty Cost Basis Price Value P/L Action
KMD Kathmandu Holdi… 10000 2.030 2.020 20,200.00 (100.00) Activity Close
MVN Methven Limited… 10000 1.390 1.480 14,800.00 900.00 Activity Close

Reference

 Vaughan, G. (June 16, 2011). Westpac sees confidence rise boosting consumer spending. Retrieved August 25, 2011 from http://www.interest.co.nz/news/49807/westpac-sees-confidence-rise-boosting-consumer-spending

 Tarrant, A. (August 18, 2011). Reserve Bank eyes economic effects of Rugby World Cup; ‘High NZ$, international debt levels concerning, so let’s hope more Aussies come’. Retrieved August 25, 2011 from http://www.interest.co.nz/currencies/54930/reserve-bank-eyes-economic-effects-rugby-world-cup-high-nz-international-debt-level

 Goh, E. (August 18, 2011). What Rugby World Cup tourism – and an early All Black exit – could mean for NZ. Retrieved August 26, 2011 from http://idealog.co.nz/news/2011/08/what-rugby-world-cup-tourism-and-early-all-black-e

 Brown, G. (May 22, 2011). Key: Boom ahead for Christchurch. Retrieved August 26, 2011 from http://www.stuff.co.nz/business/rebuilding-christchurch/5038288/Key-Boom-ahead-for-Christchurch

 Hosking, R. (March 10, 2011). Chch rebuild will fuel building boom ‘bigger than 2002-07’ – Bollard. Retrieved August 26, 2011 from http://www.nbr.co.nz/article/christchurch-rebuild-will-fuel-construction-boom-bigger-2002-07-bollard-rh-87992

Financial Diary: Analysis Objectives

Kathmandu Holdings Limited and Methven Limited are the two companies selected for my analysis.

The reason I chose Kathmandu Limited is that the winter this year was cooler than the previous years and looking at their nature of business I expect that they might have had a good season resulting in greater sales. On the other hand Methven is in the business of selling showers and other related products. Due to the Rugby world cup there are new hotels, motels and renovations taking place. Methven being a leading supplier in bathroom products it is expected that their sales would go up.

Both the companies are traded at 1NZX 50, NZX 50 Portfolio, NZX Midcap, and NZX All, hence the share can be considered as “blue chip” shares. As per investopedia blue chip shares are a nationally recognized, well-established and financially sound company shares.

My goal for this investment is that I would prefer to stick to these shares for further 5 to 6 years rather than selling them immediately. My objective is not to accumulate assets in order to achieve immediate needs. I would want to grow a nest egg for the future rather than having cash available now, hence can tolerate moderate risk.

As Warren Buffet I believe that the value of being patient is a solid factor in determining success in investing. I even strongly believe to buy and hold shares rather than to buy shares at low price and sell at high.

Currently I have invested $34,100 with 10000 shares in 2Kathmandu Limited at $2.030 per share and 10000 shares in 3Methven Limited at $1.390 per share. I have even placed an open order of 5000 Kathmandu shares and have limited the price at $1.90 per share. At this point of time I am left with $6,300 and any further investment would be subject the share price. If the share prices go down I would further buy the shares and lower the initial cost of my investment.

1NZX Limited. (2011). The New Zealand Stock Exchange. Retrieved from:   https://www.nzx.com/markets/NZSX/sectors/G05

2Kathmandu Limited (2011). Share Prices. Retrieved from: https://www.nzx.com/markets/NZSX/securities/KMD

3Methven Limited (2011). Share prices. Retrieved from: https://www.nzx.com/markets/NZSX/securities/MVN

Position Summary

Symbol Description Qty Cost Basis Price Value P/L Action
KMD Kathmandu Holdi… 10000 2.030 2.010 20,100.00 -200.00 Activity Close
MVN Methven Limited… 10000 1.390 1.410 14,100.00 200.00 Activity Close

Create a free website or blog at WordPress.com.

Design a site like this with WordPress.com
Get started